
For any trader, understanding candlestick patterns is crucial for mastering technical analysis and making informed decisions. Among the various patterns, the Hammer Candlestick Pattern stands out as a powerful indicator of a bullish reversal. In this guide, we will delve deep into the hammer candlestick and its formation, how to use it in trading, and provide a Candlestick Chart Patterns PDF for free download.
We will also explore other important candlestick patterns, including bullish candlestick patterns, bearish candlestick patterns, the doji candlestick, the shooting star candlestick, and the inverted hammer candlestick.
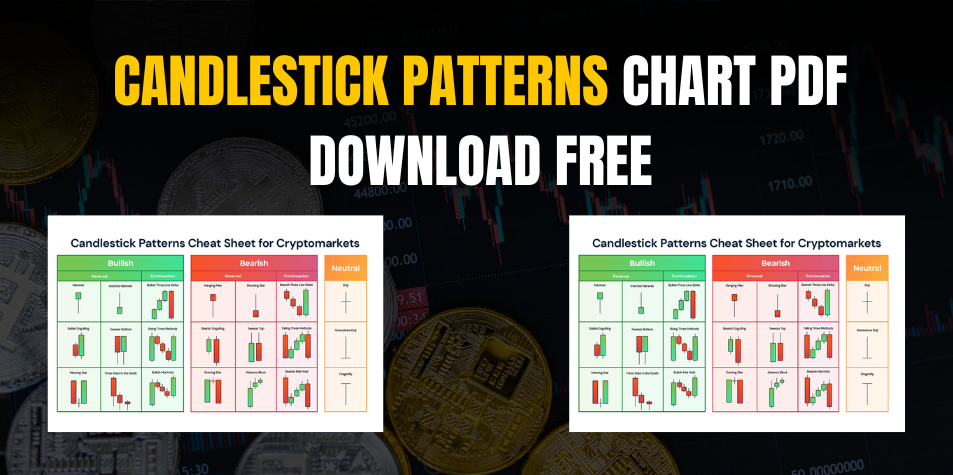
Download the Candlestick Chart Patterns PDF Free
What Are Candlestick Patterns?
Candlestick patterns are visual representations of price movements within a certain timeframe, typically used in technical analysis. Each candlestick consists of open, closed, high, and low prices, forming unique patterns that traders interpret to predict future price movements.
A candlestick chart provides more detailed insight into the market’s psychology compared to a bar or line chart. This is because the different candlestick patterns formed during trading sessions reflect the emotions and sentiments of market participants.
Some of the most well-known patterns include the hammer candlestick, shooting star candlestick, inverted hammer candlestick, and doji candlestick. Mastering these patterns helps traders spot potential market reversals or continuations, providing crucial entry and exit points.
Download the Candlestick Chart Patterns PDF Free
What is a Hammer Candlestick Pattern?
The Hammer Candlestick Pattern is a bullish reversal pattern that forms at the bottom of a downtrend. It signifies that the market may be transitioning from a bearish to a bullish phase. This pattern is characterized by a small body near the top of the candlestick and a long lower wick, indicating that despite strong selling pressure during the session, buyers managed to push the price back up, suggesting a potential upward trend.
Key Characteristics:
- Small body: Near the top, signaling a minimal change in opening and closing prices.
- Long lower shadow: Indicates that sellers initially drove the price down before buyers stepped in to reverse the trend.
- No or minimal upper shadow: This shows that the market closed near its open price.
This hammer candlestick pattern is often seen at the end of a downtrend and indicates that a price reversal is likely.
How to Identify and Trade the Hammer Candlestick
To trade using the hammer candlestick pattern, follow these steps:
- Identify the pattern: Look for the hammer shape, typically forming at the bottom of a bearish trend. The long lower wick signals buyer interest.
- Confirm with the next candlestick: Wait for the following candle to confirm the reversal by closing higher than the hammer’s close.
- Set entry and exit points: Enter the trade after confirmation. Set a stop-loss slightly below the hammer’s low to manage risk.
- Consider additional indicators: Combine with other technical indicators like RSI or moving averages to further confirm the reversal.
Download the Candlestick Chart Patterns PDF Free
Bullish Candlestick Patterns: Beyond the Hammer
In addition to the hammer candlestick, there are several other important bullish candlestick patterns that traders should be aware of. These patterns also signal reversals or continuations of trends in bullish markets.
Some of the most common bullish patterns include:
- Bullish Engulfing: A larger green candlestick completely engulfs a smaller red candlestick, showing strong buying pressure.
- Morning Star: A three-candlestick pattern where the middle candle is small, showing indecision, followed by a large bullish candle.
- Piercing Pattern: The second candle in this two-candlestick pattern opens lower but closes above the midpoint of the previous bearish candle, signaling bullish momentum.
Bearish Candlestick Patterns to Watch For
While bullish candlestick patterns indicate rising prices, traders also need to recognize bearish candlestick patterns that signal a potential price decline. These patterns help traders spot shorting opportunities or exit long positions.
Common bearish patterns include:
- Shooting Star Candlestick: This pattern forms after an uptrend, featuring a small body and long upper shadow, indicating that buyers failed to maintain control.
- Bearish Engulfing: A larger red candle engulfs the previous green candle, signaling strong selling pressure.
- Evening Star: The bearish counterpart to the Morning Star, this pattern signals the end of a bullish trend and the beginning of a bearish reversal.
Download the Candlestick Chart Patterns PDF Free
Popular Patterns: Shooting Star, Inverted Hammer, and Doji Candlestick
Some other important candlestick patterns that traders use include:
Shooting Star Candlestick:
The shooting star candlestick is the opposite of the hammer and signals a bearish reversal after an uptrend. It has a small body and a long upper wick, indicating that buyers attempted to push the price higher, but sellers overwhelmed them.
Inverted Hammer Candlestick:
The inverted hammer candlestick forms after a downtrend and signals a potential bullish reversal. It has a long upper shadow and a small body, indicating that buyers attempted to drive prices higher but were unable to sustain the momentum.
Doji Candlestick:
A doji candlestick forms when the opening and closing prices are almost identical, creating a small or non-existent body. This pattern signals indecision in the market and can be either a reversal or continuation signal, depending on the previous trend.
Download the Candlestick Chart Patterns PDF Free
Candlestick Chart Patterns PDF Download Free
For traders who want to explore candlestick patterns pdf and keep them handy for reference, we have created a free Candlestick Chart Patterns PDF that covers all major patterns, including:
- Hammer Candlestick
- Bullish Candlestick Patterns
- Bearish Candlestick Patterns
- Shooting Star Candlestick
- Inverted Hammer Candlestick
- Doji Candlestick
Download the Candlestick Chart Patterns PDF Free
This downloadable PDF is perfect for beginner and intermediate traders looking to deepen their understanding of candlestick patterns and improve their trading strategies.
8. Best Tools and Platforms for Candlestick Pattern Analysis
To effectively analyze candlestick chart patterns, traders need reliable tools and platforms that provide advanced charting features and pattern recognition. Some of the best tools for this include:
- TradingView: Offers a wide range of technical analysis tools and allows users to create custom candlestick chart patterns.
- MetaTrader: One of the most popular platforms among forex traders, providing advanced charting tools and automated pattern recognition.
- ThinkorSwim: Offers professional-level tools for analyzing and trading based on candlestick patterns.
Download the Candlestick Chart Patterns PDF Free
Conclusion
Understanding candlestick chart patterns is essential for successful trading, whether you’re a beginner or an experienced trader. The hammer candlestick pattern is a powerful tool for spotting bullish reversals, but it’s equally important to familiarize yourself with other key patterns like the shooting star candlestick, inverted hammer candlestick, and doji candlestick.
By downloading our Candlestick Patterns PDF, you’ll have a valuable resource at your fingertips, helping you spot opportunities in the market and make more informed trading decisions. Remember to always combine candlestick analysis with other indicators for the best results.
Frequently Asked Questions (FAQs)
Q: How reliable is the hammer candlestick pattern?
A: The hammer candlestick pattern is a strong indicator of a bullish reversal, but it should be used in combination with other technical indicators for greater accuracy.
Q: What is the difference between a hammer and an inverted hammer candlestick?
A: While both indicate a potential reversal, the hammer candlestick forms at the bottom of a downtrend with a long lower wick, while the inverted hammer candlestick has a long upper wick and signals a potential reversal after a downtrend.
Q: Can I use candlestick patterns for all types of trading?
A: Yes, candlestick patterns work for stocks, forex, cryptocurrencies, and commodities. They can be used on various timeframes, from intraday trading to long-term investments.